
The Margin Squeeze in Residential Real Estate: A Decade of Rising Operating Expenses in the Multifamily Sector
The US income-producing residential (multifamily) real estate market has been in crisis for roughly three years. The downturn has included a sharp decline in prices, while many sponsors and asset managers face balance-sheet and cash-flow difficulties, driven mainly by higher financing costs, rising operating expenses and slowing rent growth. Recent data point to a possible stabilization of asset prices in the market during 2025. While much of the discussion focuses on lower transaction volumes and uncertainty in the capital markets, an equally important trend is unfolding beneath the surface: rising operating expenses (OpEx) are no longer a theoretical inflation risk – they have become a decisive factor in loan performance and in changes in multifamily asset values. These assets are particularly exposed to rising operating expenses because of short lease terms and intensive management, which translate into high cost sensitivity. Although at the national level revenues still grew faster than expenses, the gap is narrowing, and the divergences across expense line items and across geographic markets show that national averages do not tell the whole story. In some major cities, operating expense growth is approaching 7% per year – well above the historical underwriting assumption of 3%–5% – while certain line items, such as property insurance, have surged at double-digit rates over the past decade.
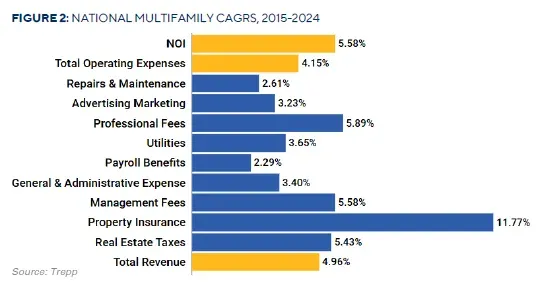
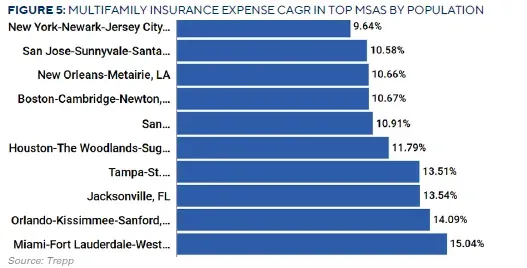
According to a study by Trepp, between 2015 and 2024 multifamily operating expenses in the US grew at an average rate of 4.15% per year, but in the 10 most populous cities they jumped by approximately 6.00% per year (and in the 25 largest: 5.30%). Insurance alone climbed by 11.77% per year on a national average – a jump that outpaced total expense growth in 24 of the 50 largest metropolitan areas. In other words, expense items that were once considered marginal – insurance, property taxes, maintenance, utilities, marketing, payroll and more – can now determine the success of an investment, materially affect borrower performance and increase portfolio risk. When expenses grow faster than revenues, they erode net operating income (NOI) and impair asset value – a tangible risk for investors in this new era.
Operating Expense Trends over the Past Decade (2015–2024):
The past decade was characterized by significant inflation across most expense line items in income-producing residential real estate. Operating expenses for multifamily properties rose by an average of approximately 4.15% per year between 2015 and 2024, compared with average growth of 4.96% in revenues and an increase of 5.58% in NOI (a figure that reflects only a slight improvement in profit margins). Behind the overall average lie gaps between the different types of expenses:
· Property insurance: The fastest-growing line item – an average increase of 11.77% per year (approximately 172% in total over the decade) – a consistent double-digit rate of inflation, far higher than the other line items.
· Real estate taxes (property taxes): An average annual increase of approximately 5.43% (approximately 61% in total over the decade), driven in part by rising property values and higher local tax rates.
- Property management fees: Grew by approximately 5.58% per year (approximately 63% in total over the decade), because they are derived from property revenues and because of the rising cost of management services.
Overall, the national picture shows cost increases across all major line items. Although NOI managed to grow slightly faster than expenses over this period, cost pressures are building beneath the surface. Geographic Analysis: Gaps Between Markets – Climate, Regulation and Competition:
As noted, there are significant differences between metropolitan areas. In some cities and regions, operating expense growth deviates sharply from the norm as a result of specific factors such as climate and natural disasters, local tax policy and regulation, or intense competition for tenants and workers. Below are several notable examples:
· Climate and natural hazards: Areas prone to natural disasters – hurricanes, floods, wildfires – are experiencing a sharp jump in insurance costs. Insurers are raising premiums and repricing risk, which has led to sustained double-digit insurance cost growth in metropolitan areas exposed to extreme weather. At the same time, markets that contend with a harsh climate or an aging housing stock suffer from above-average maintenance costs. Thus, in Salt Lake City, the Inland Empire (California) and New Orleans, maintenance expenses rose by approximately 8.8%, 8.8% and 7.8% per year, respectively – due to accelerated wear and tear from harsh weather conditions and older buildings.
· Regulation and taxation: Local fiscal policy and regulatory changes are also driving expense increases. On the tax side, Sun Belt cities such as Atlanta, Charlotte and Tampa experienced a sharp jump in residential property taxes – an increase of approximately 9.5%, 8.7% and 8.5% per year (respectively) over the past decade. In addition, a complex regulatory burden translates into higher operating costs: professional service fees (legal, accounting, compliance) grew by an average of approximately 5.9% per year.
· Competition and supply: In markets characterized by new construction supply and fierce competition for renters, marketing and advertising expenses have surged. In metropolitan areas such as Charlotte, Tampa and Phoenix, marketing expenses rose by approximately 10.85%, 8.48% and 6.89% per year, respectively – figures that reflect aggressive competition and the need for costly campaigns to attract tenants. At the same time, competition for skilled labor has pushed payroll costs above the average in several markets: in Buffalo, Columbus and Birmingham, payroll expenses grew by 6.7%, 5.6% and 5.6% per year (respectively) due to a tight labor market, while in expensive, labor-intensive areas such as New York and Washington, D.C., a slight decline in average payroll costs in the sector was even observed (possibly due to wage restraint or unionized labor contracts).
This analysis illustrates that the key to understanding operating expense risk is a local, granular view: every city and every line item can behave differently. For example, property insurance becomes a particularly critical component in markets with high climate risk, while marketing expenses depend heavily on the level of competition and supply in each area, and property taxes on the policy of the local authority. The gaps between markets underscore the importance of tailoring assumptions and forecasting accurately by location and specific factors, rather than relying on national averages alone.
Implications for NOI, Debt Service Coverage Ratio (DSCR), Leverage and Debt Yields:
The erosion of operating margins due to expense inflation is not merely an operational matter – it has direct implications for the performance of leveraged assets and for loan risk metrics. Over the past decade, although revenues at the national level grew slightly faster than expenses, the gap narrowed significantly, and in some cases it is beginning to reverse. There are already examples in which key expense line items are rising faster than rental income (for instance, property taxes in certain metropolitan areas are growing faster than rents) – which directly erodes NOI and reduces the profitability ratios of the assets.
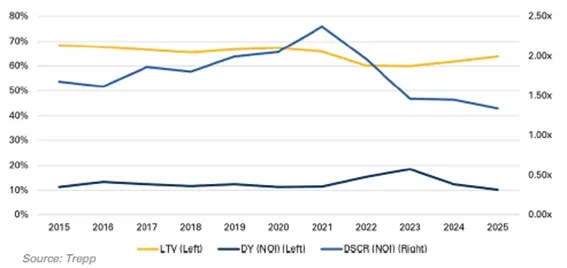
The decline in NOI resulting from rising costs leads to a deterioration in the debt service coverage ratio (DSCR) on loans. Indeed, credit data show that the average DSCR on multifamily loans fell from comfortable levels of approximately 1.6x–2.0x at the beginning of the decade to only about 1.35x in 2025. A coverage ratio of ~1.3 indicates that the property’s earnings after expenses are barely sufficient to service the debt – not far from default. Loans underwritten with thin safety margins now face growing risk: even moderate expense inflation could push the DSCR below the customary threshold (1.25x), increasing the probability of default or of the loan being transferred to special servicing. The risk is particularly high for loans whose favorable terms (such as interest-only periods) are about to expire, since a sudden increase in debt service payments combined with higher operating expenses creates a “perfect storm” for the property’s cash flow.
In response, lenders and investors have begun reacting to these trends by tightening loan structures. Throughout 2015–2021, leverage ratios (LTV) in the multifamily market remained reasonable – around the mid-60% range – and debt yields stood at 11%–13%. However, with the spike in interest rates and cost inflation after 2021, a tightening of lending standards was observed: required debt yields climbed to an average peak of 18.38% in 2023 (a requirement for higher NOI relative to the size of the debt), while LTV fell below 60% on average. In other words, banks and investors demanded higher safety margins – a willingness to finance less of the asset’s value (lower leverage) and a requirement for higher NOI relative to the loan – to compensate for cost uncertainty and to protect against revenue erosion. Over the past two years (2024–2025) there have been signs of easing in these terms, with some renewed increase in LTV ratios and a decline in required debt yields, but uncertainty around operating expenses has remained dominant and lenders have stayed cautious. As long as the potential volatility in expense items such as insurance, property taxes or maintenance remains high, it represents a structural risk for the multifamily sector that must be factored into forecasts of future performance.
An additional risk lies in refinancing: properties underwritten on overly optimistic assumptions may struggle to refinance their debt under current market conditions. Investors who reach a refi point with lower-than-expected NOI and a borderline DSCR may find that banks are willing to extend only a smaller loan (due to stricter DSCR and debt yield requirements). Already today, in metropolitan areas such as Buffalo, Jacksonville, Orlando and Columbus – which have experienced exceptional expense inflation (high single digits to double digits) – the question of refinancing capacity is on the table. Even core markets such as Los Angeles, where some expense line items grew above the average, require careful examination of financial ratios before and during refinancing. The implication for investors holding leveraged assets in these areas is that they need to prepare for scenarios requiring additional equity injections or acceptance of less favorable terms if NOI cannot support the existing debt.
Insights for Investors: Updating Models and Focusing on Expense Risk:
In light of these trends, investors in income-producing real estate and lenders need to adapt their analysis and forecasting approaches to the new reality. First, financial models need to be updated in terms of expense assumptions: one should no longer rely on a uniform rule of thumb of 3% annual expense inflation in every market, but rather build forecasts specific to each line item and market. As the Trepp report emphasizes, past norms and generic inflation factors are no longer sufficient – detailed modeling by expense category is required, adjusted for geographic risk, asset age and the policy environment in each market. Investors should apply conservative weightings to areas with climate risk (for example, incorporating scenarios of insurance spikes due to natural disasters), as well as to potential changes in local tax policy. Similarly, in markets with strong competition or a shortage of skilled workers, a higher-than-usual rate of increase in marketing and payroll expenses should be assumed.
Second, the existing portfolio should be examined under a magnifying glass to identify vulnerable assets. The data clearly point to several metropolitan areas with a “red flag” for expense growth: Buffalo, Jacksonville, Orlando and Columbus, for example, recorded cumulative double-digit growth in some OpEx line items over the past decade. These markets, along with other areas identified in the report (such as Dallas and Los Angeles, where certain cost items exceed the average), require special attention in risk management. Investors with assets in these locations should examine how far the original projections have deviated from actual performance, and update their base and downside scenarios accordingly (for example, raising expense assumptions and lowering NOI projections in their models). Assets acquired or financed at high leverage and with particularly thin operating margins require stress tests: would the property remain economically viable in a scenario of a further 5%–10% increase in insurance, property tax or maintenance expenses over the next two years?
Third, it is important to internalize that operating costs are now a material component in the pricing and risk assessment of income-producing real estate transactions. Sufficient safety margins should be required in new transactions, and investors should ensure that expected returns include a buffer for unexpected expense increases. As we have seen over the past decade, “uncontrollable” expenses such as insurance can spike sharply and turn a marginal deal into a failed one. Therefore, investors should prioritize markets and assets with relative cost control – whether through efficiency gains, long-term contracts (for procuring services such as electricity) or regulatory stability. In addition, they should maintain close dialogue with lenders: to understand how lenders currently treat expense risk in the underwriting process and what the updated requirements are for DSCR, LTV and debt yields in light of recent inflation trends.
Summary:
The trend of rising operating expenses in multifamily is a challenge that cannot be ignored in the world of income-producing real estate investment. In an era of high interest rates and moderate NOI growth, every additional dollar of expense can make the difference between a performing asset and a distressed one. Accordingly, investors and capital managers must “price the risk”: update assumptions, increase safety margins and become more selective – both in choosing geographic markets and in assessing asset condition – in order to cope with the “margin squeeze” of the coming decade.
Disclaimer:
Nothing in this publication constitutes an offer to the public or an invitation to make any investment; it is a publication and presentation of general information only. This article and its contents rely on information, publications and data received from third parties, which have been assumed to be accurate without the Company having reviewed or verified their accuracy. The information presented in this publication does not constitute investment advice/marketing or a substitute for investment advice/marketing tailored personally and specifically to each individual, taking into account their particulars, needs, financial situation, circumstances and investment objectives.
Sources:
Trepp. (2025, August). Benchmarking the Squeeze: A Decade of Multifamily Cost Inflation & Its Market Impact. Trepp Research.